Slot 30
What You’ll Need
Your dashboard is the command center for your mineral portfolio. When you first log in, most sections will be empty , the platform is waiting for you to add your properties. Onc…
Get to a first pass quickly
The starter estimate is meant to give you a fast, reviewable baseline. Use the default model settings first, then adjust pricing, decline assumptions, expense inputs, or ownership details only after you understand which inputs are driving the result.
When the first pass looks directionally right, add a short note explaining the most important assumptions. This turns the estimate into a decision record instead of a one-time calculation.
Review checkpoints
Compare model output against recent production history.
Flag assumptions that still need confirmation.
Before you begin
Nothing — you can follow along whether your dashboard is empty or fully populated. Understanding the layout now will make it much easier to read once you have added your properties.
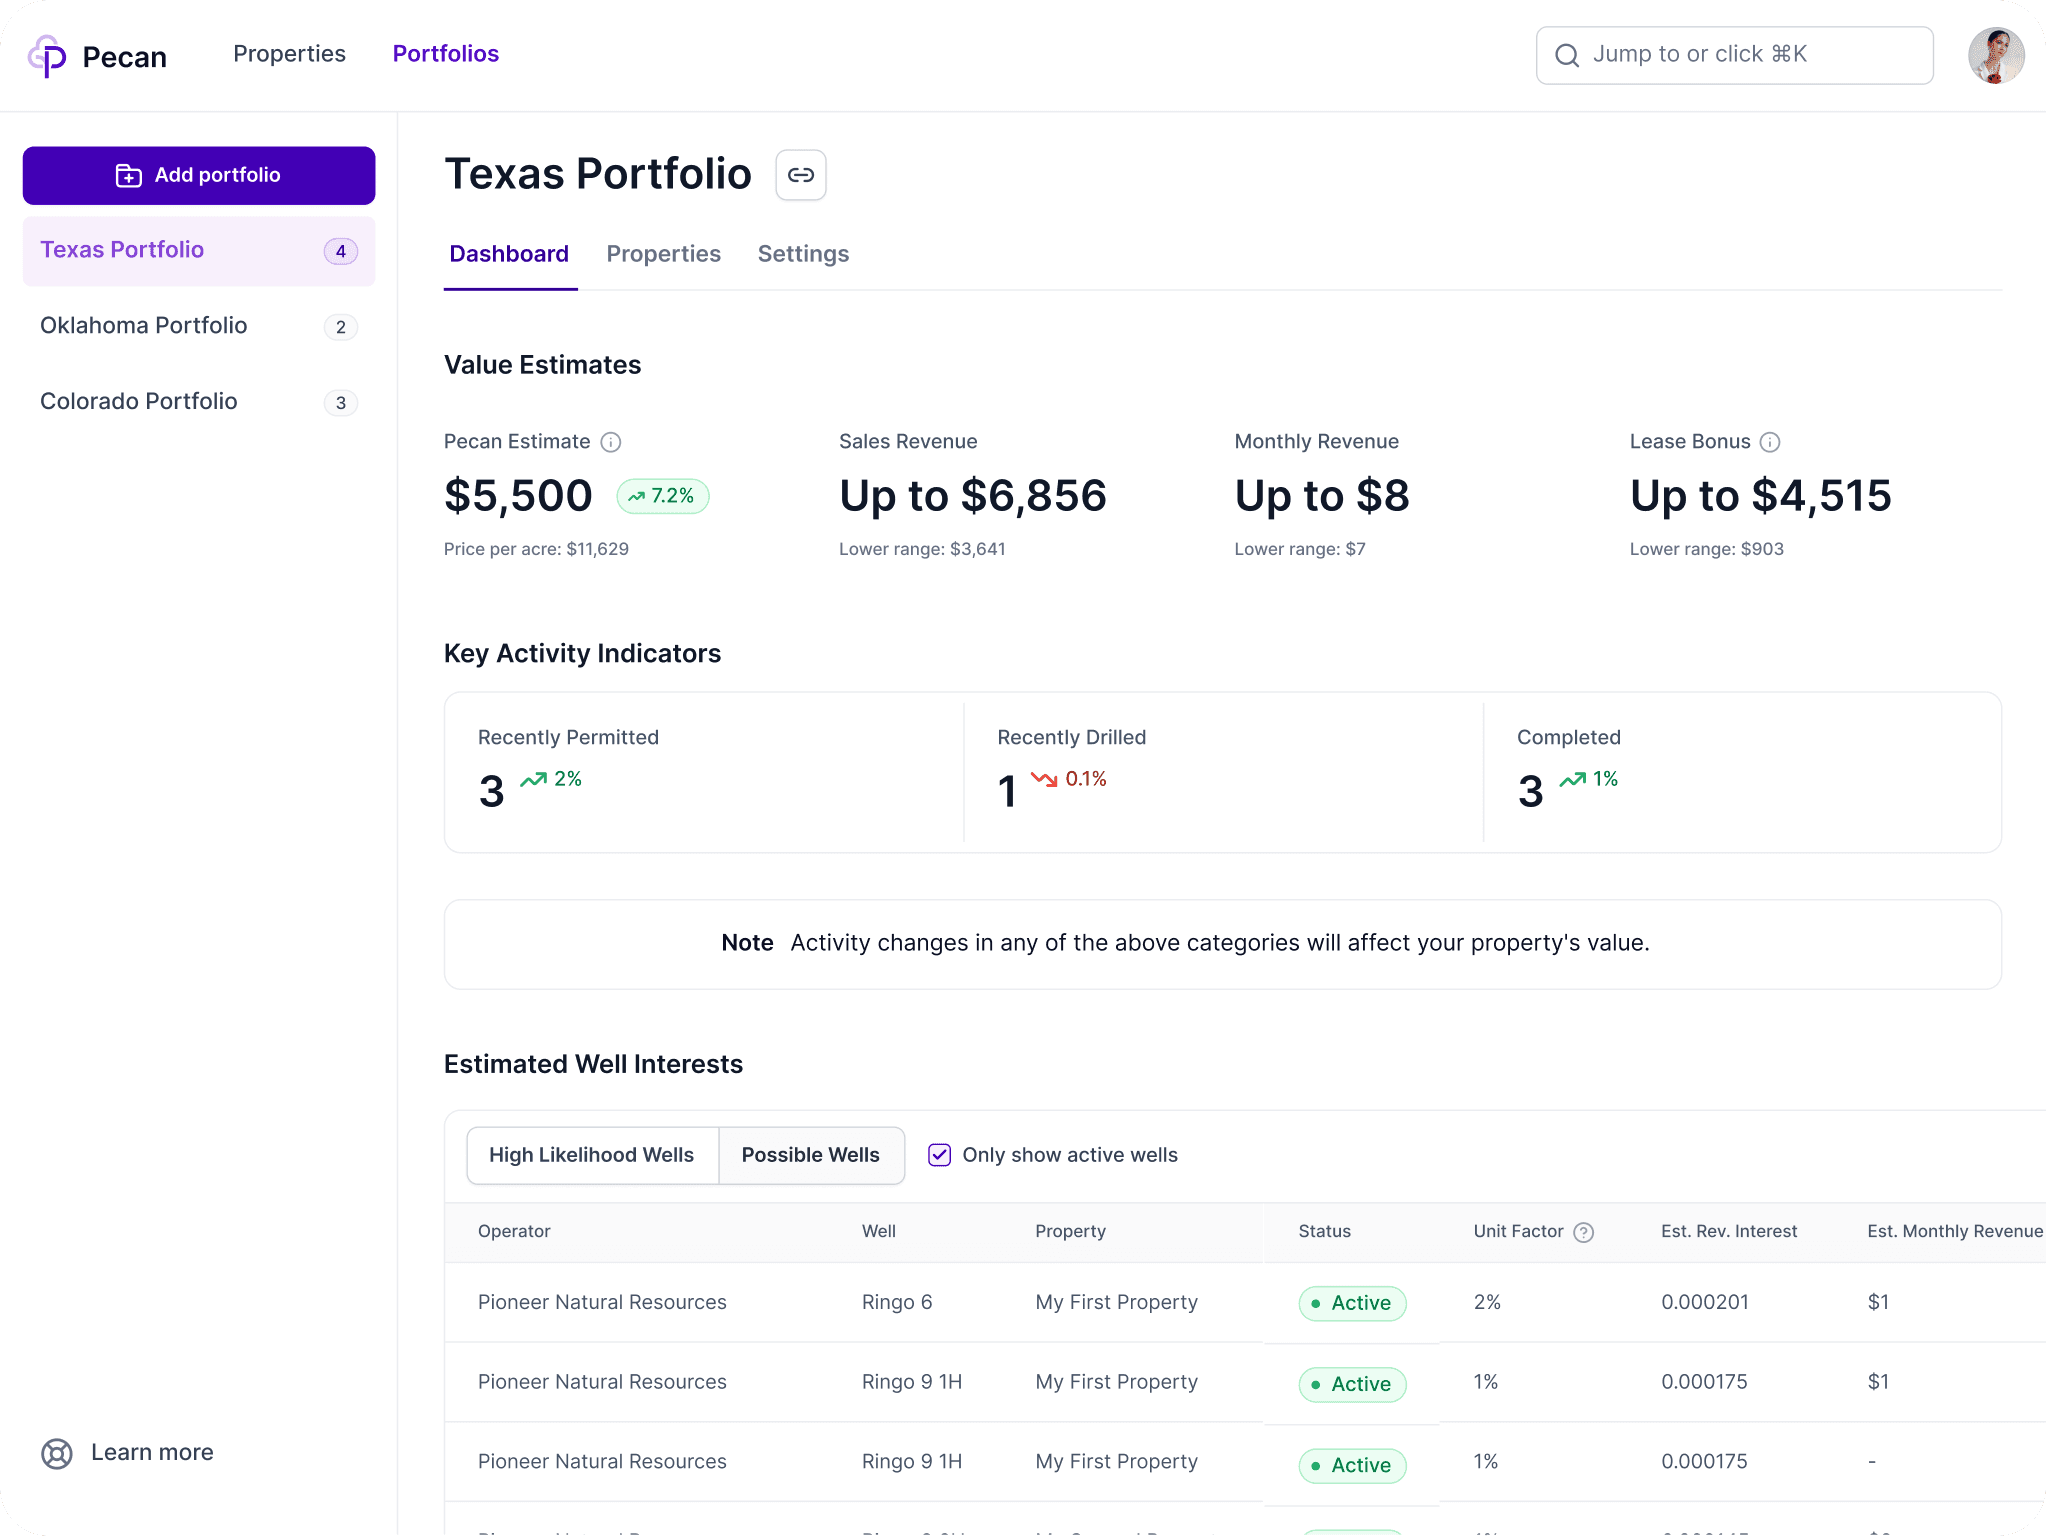
Your dashboard is the command center for your mineral portfolio. When you first log in, most sections will be empty — the platform is waiting for you to add your properties. Once you do, the dashboard updates to reflect everything you own.
Portfolio Value (Your Pecan Estimate) At the top, you will see your total portfolio value — your Pecan Estimate — aggregated across all of your tracts. This is the estimated fair market value of your mineral interests: producing wells, non-producing wells, and future drilling potential combined.
You will see a range, not a single number. That is intentional. Mineral valuations depend on buyer type, commodity prices, and risk profile. The range represents the full spectrum, from a conservative floor to an optimistic ceiling.
Asset Allocation Below your total value, you will see a breakdown of how your portfolio is allocated — by state, interest type, or producing versus non-producing value. This is most useful when you own minerals in multiple areas and want to see where your value is concentrated.
Well Revenue This section shows your estimated monthly revenue from actively producing wells across all your tracts. This is a gross revenue figure — production volume times price — and does not net out operating costs or taxes.
Future Drilling and Risk Summary Here you will see your future drilling potential and a risk overview. For many mineral owners, undeveloped acreage represents a significant portion of total asset value. This section makes that visible. The risk summary flags items worth watching: single-well concentration, production decline rates, and commodity price sensitivity.
Recent Activity If your properties have had any recent well activity — permits, spuds, completions — a summary appears here. This keeps you current without having to check each tract individually.
The dashboard reflects exactly what you have added. The more properties you enter, the more useful it becomes.
Before you begin
Nothing — you can follow along whether your dashboard is empty or fully populated. Understanding the layout now will make it much easier to read once you have added your properties.
Your dashboard is the command center for your mineral portfolio. When you first log in, most sections will be empty — the platform is waiting for you to add your properties. Once you do, the dashboard updates to reflect everything you own.
Portfolio Value (Your Pecan Estimate)
At the top, you will see your total portfolio value — your Pecan Estimate — aggregated across all of your tracts. This is the estimated fair market value of your mineral interests: producing wells, non-producing wells, and future drilling potential combined.
You will see a range, not a single number. That is intentional. Mineral valuations depend on buyer type, commodity prices, and risk profile. The range represents the full spectrum, from a conservative floor to an optimistic ceiling.
Asset Allocation
Below your total value, you will see a breakdown of how your portfolio is allocated — by state, interest type, or producing versus non-producing value. This is most useful when you own minerals in multiple areas and want to see where your value is concentrated.
Well Revenue
This section shows your estimated monthly revenue from actively producing wells across all your tracts. This is a gross revenue figure — production volume times price — and does not net out operating costs or taxes.
Future Drilling and Risk Summary
Here you will see your future drilling potential and a risk overview. For many mineral owners, undeveloped acreage represents a significant portion of total asset value. This section makes that visible. The risk summary flags items worth watching: single-well concentration, production decline rates, and commodity price sensitivity.
Recent Activity
If your properties have had any recent well activity — permits, spuds, completions — a summary appears here. This keeps you current without having to check each tract individually.
The dashboard reflects exactly what you have added. The more properties you enter, the more useful it becomes.