Method
How we value minerals
The engineering behind every Pecan value, in plain words.
What the three values mean
Your report shows a range, not a single number. Mineral value depends on who is looking, and how much credit they give to wells that have not been drilled yet.
Lower value
A cautious buyer’s read. It gives less credit to future wells and discounts them more heavily.
Fair market value
Our best estimate of the price a willing buyer and a willing seller would agree on, both knowing the facts and neither forced to act. Most buyers price near this number.
Upper value
What a seller could argue for if every future well is counted with confidence.
Your report is not an offer.
It is not an offer to buy, and it is not advice to hold or sell. It is our independent read of today’s market, as of the effective date on the report. Use it to judge any offer you receive.
The method in four steps
Every Pecan value comes from the same engineering method, whether you own ten acres or ten thousand. Here it is in four steps.
01
Forecast every well
We forecast future production for each well on and around your tract, from its own production history and from similar wells nearby.
02
Price the production
We price that oil and gas on the NYMEX futures curve, then subtract regional price differences and post-production costs.
03
Risk and discount by category
Producing wells count in full. Future wells count for less, and are discounted at a higher rate, because they are less certain.
04
Value the tract, then apply your share
We value the whole tract, then apply your interest: your net mineral acres and your lease royalty.
Every value is built from public data you can check, run through methods the industry already trusts.
Where a tract has no wells or future locations yet, we look at nearby activity, lease bonuses and sales instead. The full method, with sources, is further down this page.
Check the numbers yourself
You don’t have to take our word for it. Each number that is specific to you can be checked against papers you already have.
Your interest and acres
Compare with your deed, probate papers, or division order.
Your lease royalty
Compare with your oil and gas lease. Or divide the decimal on your royalty statement by your share of the unit: your net mineral acres divided by the unit’s acres.
Your current income
Compare our 12-month income estimate with your last twelve months of royalty statements.
Your wells
Look up each well by its API number in your state’s public well records.
If something doesn’t match, tell us.
We build each report from public records and what you share with us. We don’t examine title, so your own documents are the best check on your interest. Send us what you have, and we will recheck the numbers and update the report.
Who’s behind the number
I’m Tracy Lenz, the founder and lead engineer at Pecan Tree. I’m a licensed Professional Engineer and a Certified Mineral Appraiser, and I built the method on this page.
Registered engineering firm
Pecan Tree, Inc. is a Texas Registered Engineering Firm, F-21124. Tracy Lenz is a Texas Professional Engineer (PE #132654) and an IIMA Certified Mineral Appraiser (#2020-06).
Industry standards
We follow the reserve standards used in public reporting (SPE-PRMS, SEC and SPEE). We use the word “appraisal” only for work that follows USPAP.
Independent
We are not a party to any sale of your interest, and our fee does not depend on the value we reach.
The same model and type curves go into the reports we prepare for lenders, estates and buyers.
I started Pecan Tree in 2020 to bring the engineering that large companies pay for to mineral owners, a part of the industry most engineering firms had ignored. The answer was to do the heavy work once, ahead of time, across the country, so every owner gets the same method. Read the full story.
Questions? Talk to an engineer.
We’re glad to walk you through any number on your report. Call the office, or book a time that works for you.
The full method, in detail
For owners who want the nitty-gritty, and for technical teams evaluating our work. Every section has its own link, so you can send exactly the part someone needs.
10 The hex grid
13 References
Standards we follow
Most of the model uses methods recommended by the Society of Petroleum Evaluation Engineers. They rest on the same system the SEC uses for public reserves reporting: the Petroleum Resources Management System, or PRMS.
PRMS
SPE, WPC, AAPG and SPEE. The controlling system for classifying reserves and resources.
SEC
Regulation S-X, Rule 4-10. The U.S. public-reporting rules, built on the same PRMS backbone.
SPEE
Monographs and the annual parameter survey. They inform our discounting, forecasting and undeveloped-reserve methods.
USPAP
The Appraisal Foundation. The appraisal-practice standard we hold ourselves to whenever we use the word “appraisal.”
Where our own modeling choices depart from or extend these standards, we say so in the section where it happens.
Those Pecan choices include the one-mile proven test, the 20% economic screen and the 20-mile proximity model. Each is marked below.

What goes in, what comes out
At its core, the model is a collection of equations and assumptions used to calculate the value of any plot of land based on the data specific to that location.
Some of that data is proprietary, but much of it is public. Some of those equations are off the shelf solutions like ComboCurve for our economic modeling, and some of the equations are made in-house using data-driven approximations.
Engineering Valuation Model
Pecan Estimate
Geology & Engineering
Decline Curve & Type Wells
Estimated Ultimate Recovery
Reserve Analysis (3P)
GIS Mapping
Appraisal Methods
Discounted Cash Flow
Income / Lease Bonus Multiples
Comparative Sales
USPAP
Market Inputs
Society of Petroleum Evaluation Engineers
Buyer / Seller Feedback
NYMEX Commodity Futures
Proprietary Data
Aggregated & anonymous client-submitted data
In-House Data Analysis & Models
Public Data
Wells, Production, Filings, Permits, Rigs, Locations (WellDatabase)
Tax Appraisal Data
Investor Presentations
Definition of market value
We use the federal codified definition, which matches the SPEE definition for oil and gas interests. USPAP does not define market value itself. It requires that a definition be stated and cited, so we state it here.
“The price at which the tract would change hands between a willing buyer and a willing seller, neither being under any compulsion to buy or sell and both having reasonable knowledge of the relevant facts.”
12 CFR § 34.42. Implicit in the definition is a sale as of a specified date, with title passing from seller to buyer.
Conditions of the sale
Buyer and seller are typically motivated.
Both are well informed or well advised, and acting in their own best interests.
A reasonable time is allowed for exposure in the open market.
Payment is in U.S. dollars or comparable financial arrangements.
The price is normal consideration, unaffected by special financing or concessions.
What can move value for a given buyer or seller
A seller’s or buyer’s own criteria can run well above or below market.
Future production depends on pipelines, connections, well condition and how the wells are operated.
Price forecasts are subjective, and different parties weight them differently.
Future revenue carries real risk from mechanical, operator and market events.
Reserve categories and statuses
Following SPE-PRMS, reserves fall into three categories by certainty: Proved (1P, P90), Probable (2P, P50) and Possible (3P, P10). Probable and Possible together are called unproved reserves.

The PRMS resource classification framework, with the 1P / 2P / 3P and 1C / 2C / 3C confidence levels running left to right (SPE et al. 2018).
PDP
Proved Developed Producing
Recovered from intervals open and producing at the time of the estimate.
PDNP
Proved Developed Non-Producing
Shut-in and behind-pipe reserves. A well that is drilled and completed but waiting on first production is treated as PDNP.
PDSI
Proved Developed Shut-In
Developed reserves in a well that is temporarily not producing.
PUD · PROB · POSS
Undeveloped
Volumes that need future investment. A well that is drilled but not completed still faces a major completion cost, so it is treated as undeveloped, consistent with the PRMS and SEC test.
Production forecasting
Most onshore U.S. production is forecast with decline curve analysis for producing wells, and with analogy for undrilled and newly drilled wells. We use both, in harmony.
Decline curves
A modified Arps hyperbolic decline with a terminal exponential decline and a reservoir-appropriate maximum b-factor. It is the most common method in the 2025 SPEE survey.
7% terminal decline
Matches the 2025 SPEE survey mean for unconventional horizontal wells (median 6%).
Type wells
For future wells, a type well is built from analogous wells in the area, consistent with SPEE Monographs 3 and 4.
Exceptions
Waterfloods, CO2 floods, new vertical wells and reservoirs with strong aquifer drive, common in Gulf Coast sands, use methods suited to their drive mechanism.
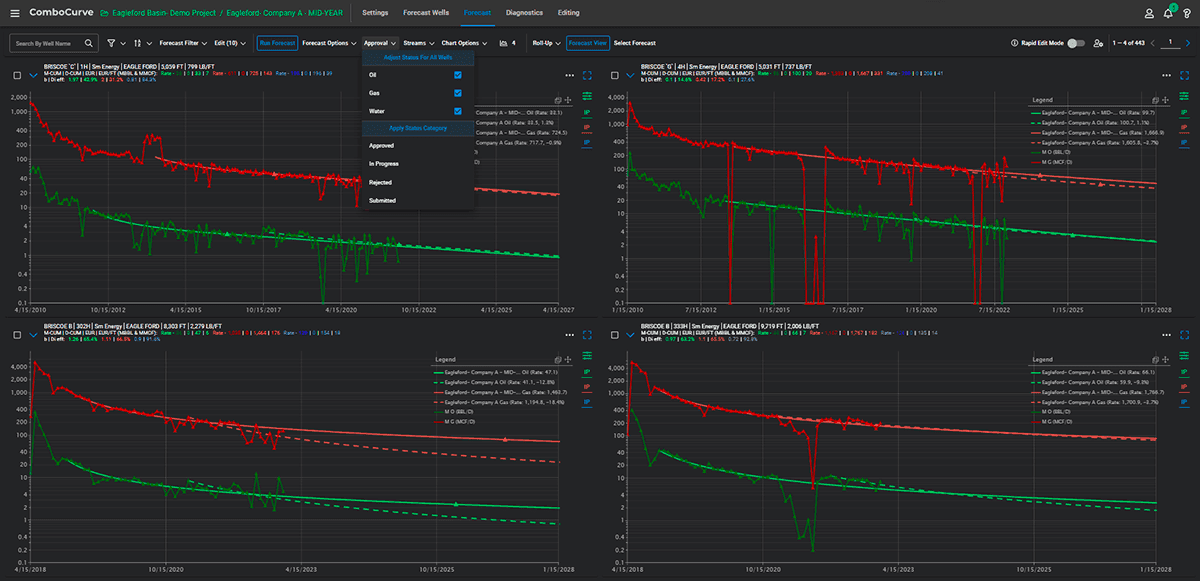
Decline curve analysis in ComboCurve. Each well’s history is fit and forecast, and the fits roll up into the area type curve.
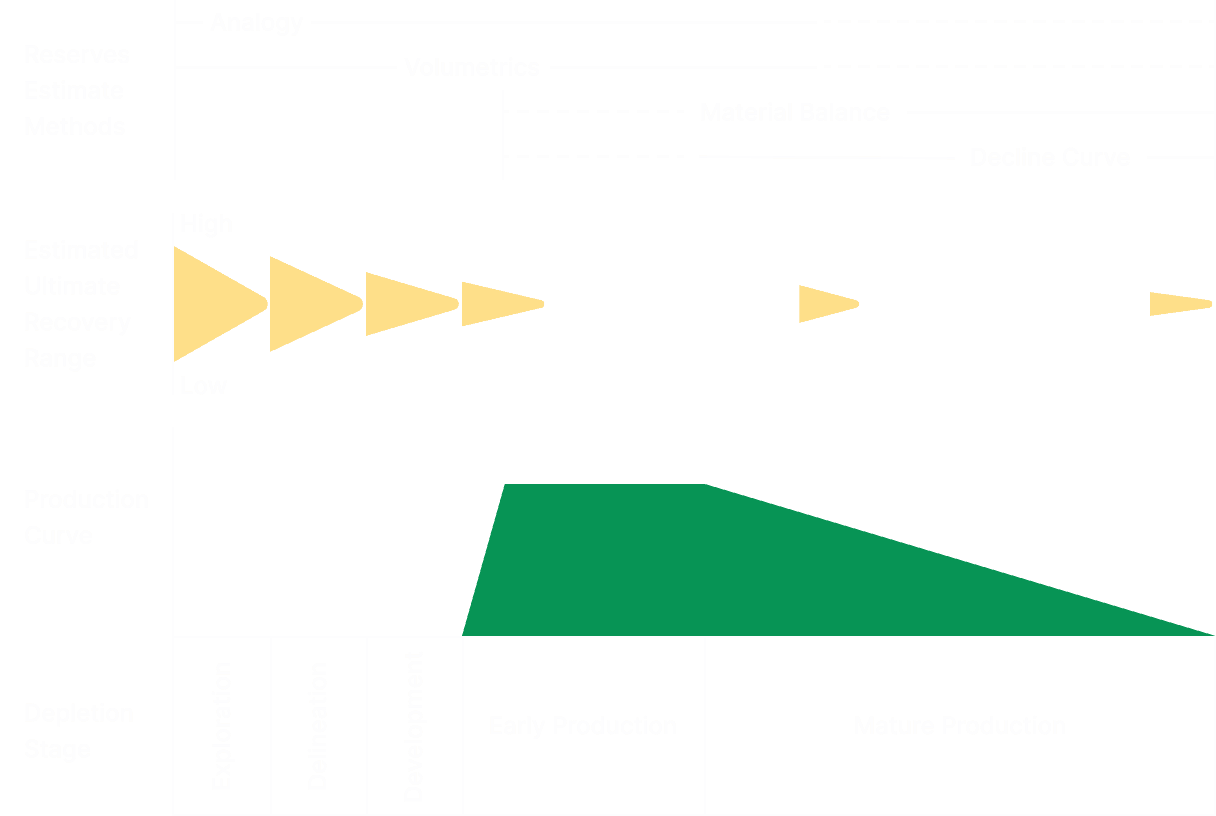
Estimate methods shift from analogy and volumetrics toward decline curves as a field matures.
About 185,000 wells and 415 unique type curves in our ComboCurve library (2026).
ComboCurve is an industry-leading tool for engineering and economic analysis. It is the library every Pecan estimate draws from.
How much is proven
In unconventional shale, we use analogy and the maturity of nearby development to quantify how much of a reservoir is Proved, Probable and Possible.
Well-to-well spread
The P90/P10 ratio measures the spread between the best and worst wells in the analog set. A tighter spread means more can be called Proved.
Sample size
A single offset well is not a reliable predictor, so the model leans on the whole analog distribution. This is the heart of SPEE Monograph 3.
The one-mile test
Acreage counts as proven where there is established production within one mile in the same reservoir. It is a reasonable-certainty convention layered on the statistics, not a replacement for them.
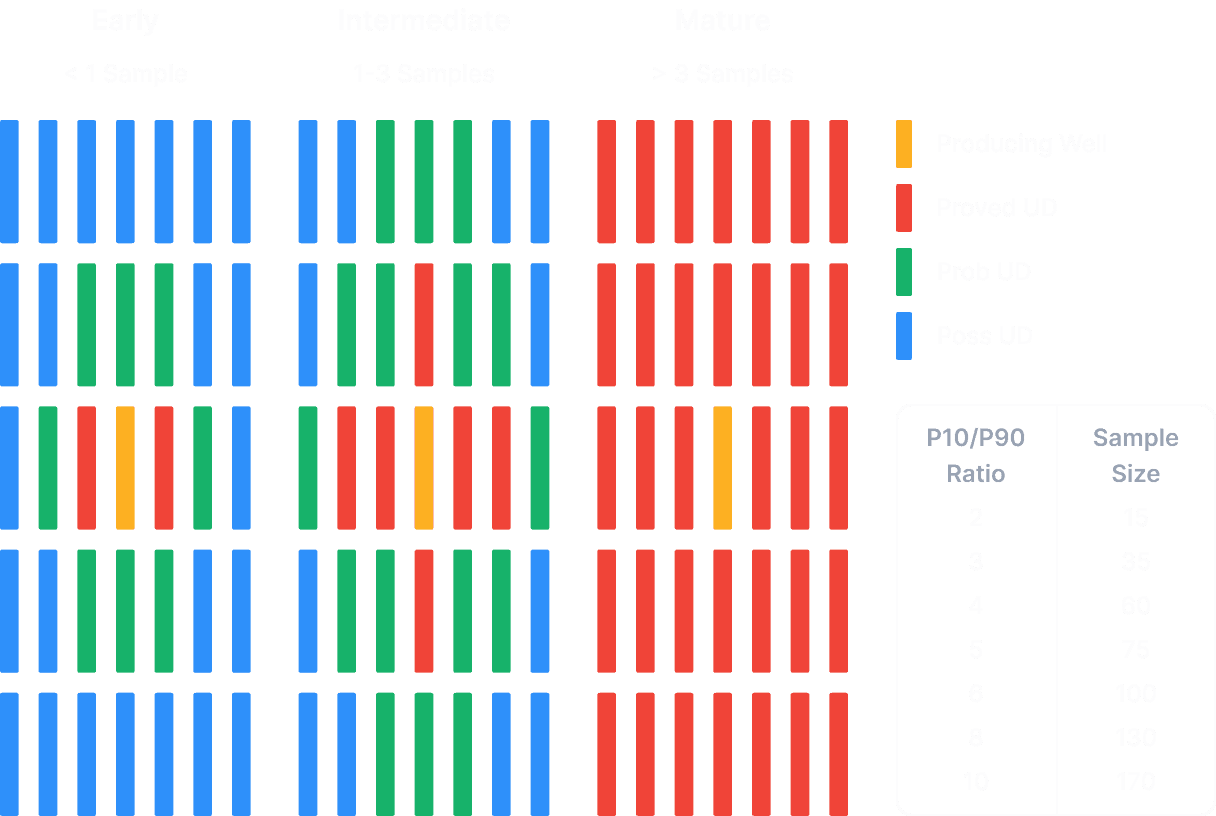
Well-to-well variability in an analog set. The P90/P10 ratio and the sample size together drive how much can be called Proved.
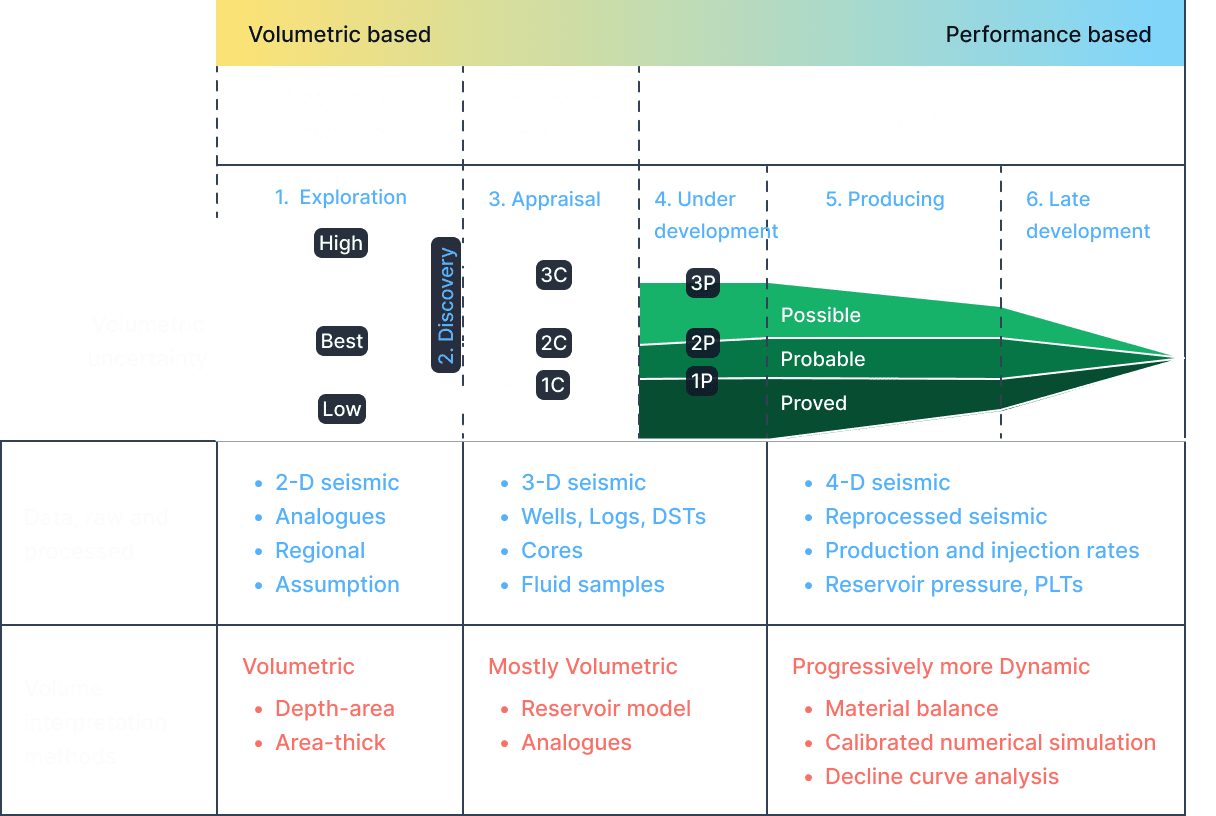
As a play matures, estimates move from volumetric to performance-based and the range narrows. Illustrative only: final volumes can fall inside or outside each range.
Certainty is value. Uncertainty is risk.
As an area moves from exploration to development, the range of recoverable volume narrows, and value follows.
Commodity pricing
Future prices follow the NYMEX forward curve (the strip) for WTI crude oil and Henry Hub natural gas: 124 months of futures, held flat after that.
Why the strip
Forward pricing is the most common basis for property valuation. In the 2025 SPEE survey, NYMEX futures were the most-cited price source (36%), used more than twice as often as SEC pricing (15%).
NGLs at 41% of WTI
Based on a trailing-twelve-month blend that approximates an NGL barrel: 45% Henry Hub gas, 25% Mont Belvieu propane, 25% Gulf Coast gasoline and 5% WTI crude.
Differentials and costs
Basin-specific differentials adjust WTI and Henry Hub for oil quality and regional hubs. Gathering, processing and other fees come off as post-production costs.
This differs from SEC reserves reporting, which uses a trailing twelve-month average of first-of-month prices, held flat.
A note on timing: a well’s latest monthly revenue is priced at historical prices for its latest month of production, which often lags three to five months. You can confirm that month from the well’s Last Production Date on the Wells page, by API-14 number.
Discount and risk
A royalty in a Proved, producing tract with steady income typically reconciles at a 10% discount rate. That is the SEC PV-10 benchmark, and it matches the 2025 SPEE survey median for operated PDP. A royalty carries less risk than an operated working interest, so 10% is, if anything, slightly conservative.
We price risk on two separate axes, and we are careful not to count it twice.
The risk-adjusted discount rate (RADR) handles uncertainty in timing. The reserve adjustment factor (RAF) handles uncertainty in volume. The SPEE survey shows reserves risk is the most-cited reason to raise a discount rate (87% of respondents), so our proved rates sit at or below the survey medians and the RAF carries the volume risk.
Reserve category
Typical RADR
Typical RAF
SPEE 2025 median RADR
Proved Developed Producing (PDP)
10%
100%
10%
Proved Developed Non-Producing (PDNP)
10%
80%
15%
Proved Undeveloped (PUD)
20%
55%
25%
Probable Undeveloped (PROB)
30%
25%
30%
Possible Undeveloped (POSS)
40%
5%
37.5%
These are typical values. Custom reports can use different settings, and every Pecan report states the settings it used. SPEE medians are for operated working interests and are rounded.
Undeveloped value
Where a location has no production yet but sits in proven reservoir, we value it with an engineering cash-flow analysis built on a type well.
Modern wells only
Type wells are built from analogous wells drilled in 2017 or later, to match current drilling and completion technology.
Normalized laterals
Type wells are scaled to the local lateral length, typically 5,000 to 10,000 feet.
Costs and timing
Drilling and completion costs are estimated from depth, length and completion type, alongside timing, prices and other economic inputs.
A 20% economic screen
A location counts as economic when a type well clears a 20% internal rate of return for the working-interest owner at current pricing. This is our own hurdle rate, separate from the 10% PV-10 reporting rate.
The hex grid
A hexagonal grid is the model’s backbone. Each cell is about one mile across, and the heavy reserve-volume equations above are solved at this level, ahead of time, for the whole country.

The hex grid, about one mile per cell, laid over tracts and wells. A tract’s value is derived from the cells it touches.
Solved ahead of time
Each cell records which reservoirs are present and, for each, the percent that is PDP, PDNP, PDSI, PUD, PROB and POSS. We rerun it whenever the engineering interpretation for an area is updated, not on demand.
Finished on demand
When a tract is submitted, we compare it to the cells beneath it and adjust for units, well positions and other items unique to the tract. The heavy lifting is already done, so this takes seconds.
Proximity-based market indication
When a tract has no reserves to value, producing or undeveloped, we use a proprietary proximity model. It looks at value and activity within 20 miles, tuned with reported lease bonuses and comparable sales, because minerals are worth more closer to known reserves.
Built on recognized methods
Sales comparison, lease bonus and offer data as market evidence, and the analog method that SPE-PRMS recognizes for inferring value from nearby production.
Assembled our own way
The 20-mile radius, the step from distance and activity to a dollar figure, and its use where no reserves exist are Pecan choices, not a formal industry standard. So we call it a market indication, not a reserves-based value and not an appraisal.
This indication is speculative.
It cannot account for technical or geological developments that are not yet public. Until they are, it lets production from new wells lift the value of the surrounding area. If you believe an area should carry value for a reservoir we have not listed, contact us and we will re-evaluate it.
What the Pecan Estimate is, and is not
As a Certified Mineral Appraiser, I am careful with the public trust in the word “appraisal.”
You will never see the word appraisal here unless it refers to work that follows USPAP.
The Pecan Estimate is a strong approximation and a good starting point. It is not a replacement for the detailed technical appraisal needed for capital gains, estate tax basis or other formal uses. When that rigor is needed, it is a different engagement, and we are glad to talk about it.
References
Appraisal Standards Board. Uniform Standards of Professional Appraisal Practice (USPAP). Current edition. Washington, DC: The Appraisal Foundation.
Mercer Capital. 2018. “Accounting for Risk in Oil and Gas Reserve Valuations.” Energy Valuation Insights.
Office of the Comptroller of the Currency. 12 CFR § 34.42, Definitions. U.S. Code of Federal Regulations.
Seidle, John. 2016. Estimating Ultimate Recovery of Developed Wells in Low-Permeability Reservoirs (Monograph 4). Houston: SPEE.
Sidle, Ronald, and W. John Lee. 2010. “An Update on the Use of Analogy for Oil and Gas Reserves Estimation.” SPEE.
SPE, WPC, AAPG and SPEE. 2018. Petroleum Resources Management System (PRMS), v1.03.
SPEE. 2002. Perspectives on the Fair Market Value of Oil and Gas Interests (Monograph 2).
SPEE. 2011. Guidelines for the Practical Evaluation of Undeveloped Reserves in Resource Plays (Monograph 3).
SPEE. 2025. 44th Annual Survey of Parameters Used in Property Evaluation.
U.S. Securities and Exchange Commission. 2009. Modernization of Oil and Gas Reporting. Release No. 33-8995 (Reg S-X Rule 4-10).
WellDatabase. Production, permits, rig location and well status data.
NYMEX crude oil and natural gas futures, via Investing.com.
Last updated September 2026.